Sunday, November 22, 2009


Saturday, November 21, 2009
Markets Update

We are in a difficult period to gauge what we are doing structure wise in the markets.
It's just one of those situations where we won't truly know what structure has traced until after the fact, which is not uncommon to most technicians.
It makes it hard for position traders, and to some extent, swing traders like myself to position a solid trade due to the tighten ranges here.
The 15 minute pit session chart shows an island reversal. This is basically an exhaustion gap that is followed by a breakaway gap in the opposite direction.
I am counting the move off the 1112.25 H as a 5 wave structure. You could argue for a 3, but I think it should count as a 5.
This implies that after a retrace process we should see an additional 5 waves down, at minimum.
It appears that we have 5 small waves up from the 1085.25 L, which I have labeled as a sub-minuette degree a or i.
Drilling down further, we can see that it appears that micro [A] is complete. We should get a small [B] retracement (levels on chart) when globex opens, followed by a [C] leg lower.
At that point, I would expect to see a 5 wave structure higher of sub-minuette degree.
Any trade through the 1085.25 L would invalidate this view.
The weekly view suggests that we should see additional downside pressure on price.
This past week saw price action fill the long standing gap from October 08.
Also to note we had a cycle high due and a new moon which usual signals a reversal in the market. All this suggests we may see lower price, though never a certainty.

Friday, November 20, 2009
Soybeans

A breakout week for beans. Price traded through the 1029.50 H, and more importantly, the 1041.50 H.
This more than likely signals that primary [C] of a double zigzag of cycle c has commenced.
There is still an outside chance that we are still tracing primary [B], though I believe those odds are low.
Upside targets are where (3) = (1) at 1100.50, and (3) = 161.8% of (1) at 1192.75. [C] = [A] at 1174.
Drilling down intraday, you see that price is having a struggle getting past the 1050 level. This happens to be the 127.2% expansion of (2), which does get my attention, but my guess is it will be short lived as resistance.
Bottom line - It was sort of a messy start to this leg, but things appear to be progressing in impulsive fashion. I am near-term bullish this market until proven otherwise.
Wheat
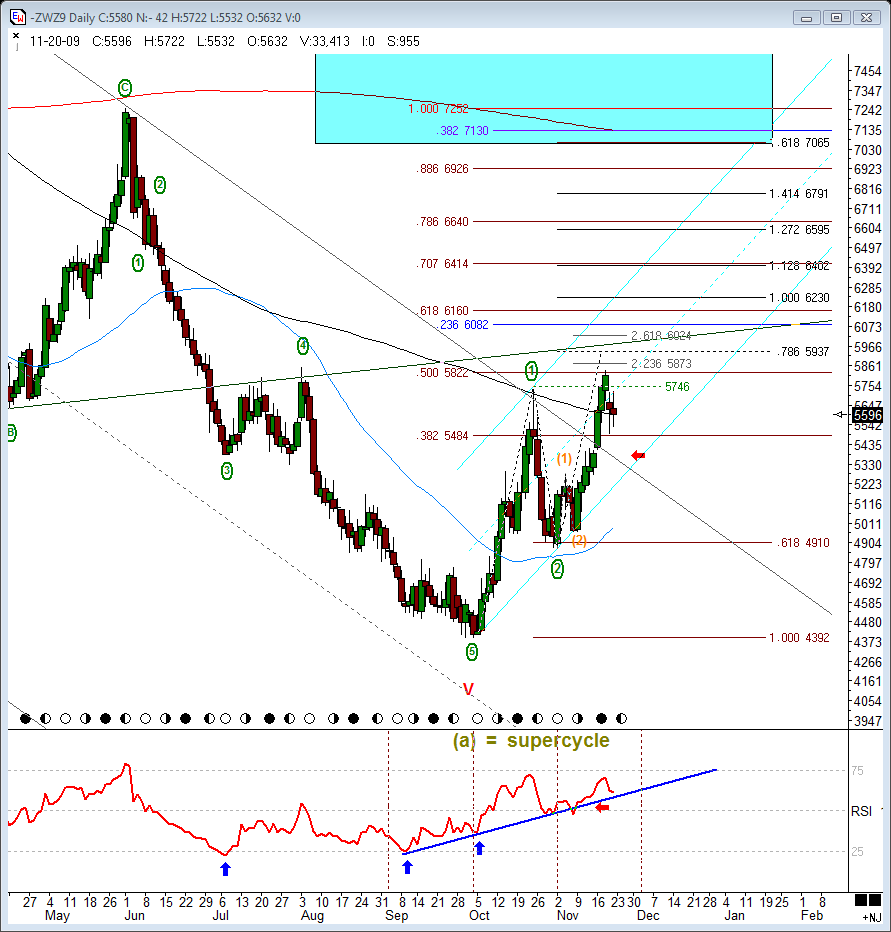
Big breakout week in the wheat market.
Price confidently traded through the primary [1] high, suggesting that primary wave [3] was underway, and more specific, a "third of third."
The alternative is that [2] is still tracing and this is nothing more than a (C) leg on a coke binge.
I believe this little pullback is nothing more than a smaller degree 4 wave, possible of minor degree, though it may very well be intermediate.
Since we have decisively broken out of the down channel, we should expect it to become support if price were to trade that low.
Notice how price has supported on the 200 sma after breaking through.
Upside targets include [3] = [1] at 623.25, and [3] = 161.8% of [1] at 706.75.
Bottom line - I am near-term very bullish this market. Any trade through the intermediate (1) H of 528.25 would quickly change this view.
Subscribe to:
Posts (Atom)