Off on my holidays till next monday. Hope everyone has a healthy and prosperous New Year.
MARKETJEDI
Tuesday, December 29, 2009
Monday, December 28, 2009
Gold
The technical picture for gold has brightened considerably over the past week, despite the price having continued to drop and the apparent failure of an uptrend. The reasons for this are to be found in the price action of gold itself and in what has been going on elsewhere at the same time.

On the 1-year chart we can see how the current downtrend continued to take the price lower early in the week before it bounced back late in the week as the market wound down for the Christmas holiday. Failure of the parabolic uptrend channel was followed by a breach of the parallel uptrend channel, as we had expected, however, applying our 3% rule we see that gold did not drop below our general stop for the sector at $1067 before it bounced above an important support level. With gold just above this support and now oversold on its MACD and various other shorter-term indicators, and still in the vicinity of its rising 50-day moving average, this is a good place for it to turn up. With respect to the trendline failure we should note that it is a favorite trick of Big Money to execute trendline failures in order to run people out of their positions before prices reverse sharply in the other direction.

On the 1-year chart we can see how the current downtrend continued to take the price lower early in the week before it bounced back late in the week as the market wound down for the Christmas holiday. Failure of the parabolic uptrend channel was followed by a breach of the parallel uptrend channel, as we had expected, however, applying our 3% rule we see that gold did not drop below our general stop for the sector at $1067 before it bounced above an important support level. With gold just above this support and now oversold on its MACD and various other shorter-term indicators, and still in the vicinity of its rising 50-day moving average, this is a good place for it to turn up. With respect to the trendline failure we should note that it is a favorite trick of Big Money to execute trendline failures in order to run people out of their positions before prices reverse sharply in the other direction.
Out of town-PALM
Will be out of town for the next couple of days. Just want to leave you with a short I believe will work for the new year. PALM
Friday, December 25, 2009
Happy holidays
Happy holidays to the world and I hope we all remember the important things in life, like our health, respect for others, family and TRUE friendship, not phonies that pretend and are just seeking out there own agenda. I am done with such people for ever, you should to! Garvey said a friend is not someone who speaks good of you but a friend is someone who shares your pain and I have learnt that the hard way.
Hope everyone enjoy their holidays no matter where and what they are doing.
MARKETJEDI
Hope everyone enjoy their holidays no matter where and what they are doing.
MARKETJEDI
Wednesday, December 23, 2009
Happy Holidays
That's it for me folks till next week, have a safe and happy holidays.
Structure measurement seems we can hit 1129 on the S&P we will see if that does happen.
MARKETJEDI
Structure measurement seems we can hit 1129 on the S&P we will see if that does happen.
MARKETJEDI
Tuesday, December 22, 2009
A little higher
I still think that 1124 number is possible just not today. We will see how the rest of the year pans out. In the mean time most have stopped trading and the only ones out there are the amateurs so don't put much technical reasoning behind this melt up :)
Also I hear Art Cashin this morning talking about he doesn't trust this rally but he claimed he has been saying that since July. The point here is the market can stay irrational longer than we can stay solvent so best to step aside in these periods.
Also I hear Art Cashin this morning talking about he doesn't trust this rally but he claimed he has been saying that since July. The point here is the market can stay irrational longer than we can stay solvent so best to step aside in these periods.
Growth Rate
From Yahoo Finance:
WASHINGTON (AP) -- The economy grew at a 2.2 percent pace in the third quarter, as the recovery got off to a weaker start than previously thought. However, all signs suggest the economy will end the year on stronger footing.
The Commerce Department's new reading on gross domestic product for the July-to-September quarter was slower than the 2.8 percent growth rate estimated just a month ago. Economists were predicting that figure wouldn't be revised in the government's final estimate on third-quarter GDP.
The main factors behind the downgrade: consumers didn't spend as much, commercial construction was weaker, business investment in equipment and software was a bit softer and companies cut back more on inventories, according to Tuesday's report.
Despite the lower reading, the economy managed to finally return to growth during the quarter, after a record four straight quarters of decline. That signaled the deepest and longest recession since the 1930s had ended, and the economy had entered into a new fragile phase of recovery.
Many analysts believe the economy is on track for a better finish in the current quarter.
The economy is probably growing at nearly 4 percent in the October-to-December quarter, analysts say. If they're right, that would mark the strongest showing since 5.4 percent growth in the first quarter of 2006 -- well before the recession began. The government will release its first estimate of fourth-quarter economic activity on Jan. 29.
Yet even such growth wouldn't be enough to quickly drive down the unemployment rate, now at 10 percent. High unemployment and tight credit for both consumers and businesses are expected to continue to weigh on the economic recovery. Many economists predict the economy's growth will slow to a pace of around 2 or 3 percent in the first three months of 2010.
Growth in the final quarter is expected to be driven by companies restocking depleted inventories. Stocks of goods were slashed at a record pace during the recession. So even the smallest pickup in customer demand will force factories to step up production and boost overall economic activity in the final quarter.
Stronger sales of exports to foreign customers, as well as spending by U.S. consumers and businesses, also will help underpin fourth-quarter growth.
It's been a wild ride for the economy this year. In the first three months, it shrank at a pace of 6.4 percent -- its worst downhill slide in 27 years.
The recession eased in the second quarter, with the economy dipping at a pace of just 0.7 percent. The economy returned to growth in the third quarter.
But much of the third quarter's growth was supported by government stimulus spending. The Cash for Clunkers rebates and an $8,000 tax credit for first-time home buyers buoyed sales of cars and homes. The clunkers program ended in August, though the tax credit has been extended and expanded beyond first-time buyers.
The government makes three estimates of GDP, which measures the value of all goods and services produced in the United States, for a given quarter. Each estimate is based on more complete data. The government's initial estimate for the third quarter was more energetic, showing the economy's growth at a 3.5 percent pace. Subsequent estimates, however, showed the recovery was actually slower.
Tuesday's report showed consumer spending grew at a 2.8 percent pace, slightly weaker than the 2.9 percent pace previously estimated and one of the factors behind the lower overall reading.
Retail sales, however, showed decent momentum in October and November, raising hopes that holiday sales would fare better than last year, which was the worst in nearly four decades.
Still, unlike previous economic recoveries, consumers, whose spending accounts for 70 percent of overall economic activity, aren't expected to solely power this one. Businesses and the government are having to pitch in more.
A trouble spot for the economy -- the commercial real-estate market -- was clearly visible in Tuesday's report.
Builders slashed spending on commercial building projects at an annualized pace of 18.4 percent in the third quarter. That was sharper than the 15.1 percent pace previously estimated and contributed to the GDP downgrade.
Business spending on equipment and software, meanwhile, grew at a 1.5 percent pace, less than the 2.3 percent growth rate estimated a month ago.
Furthermore, businesses cut inventories more deeply, by $139.2 billion in the third quarter. However, with inventories at rock-bottom levels, businesses are starting to replenish them, which should support the economy.
It's unclear how the recovery will fare once the government withdraws stimulus programs put in place to combat the financial crisis and the recession. If consumers pull back on spending, the economy could tip back into recession.
Economists at Capital Economics predict the recovery will slow, with the economy's growth fading to just 1.5 percent in 2011.
Against that backdrop, the Federal Reserve pledged last week to keep interest rates at a record low to help the recovery gain traction.
Faced with the prospects of high unemployment well into the 2012 presidential election year, President Barack Obama wants the government to take further steps to put Americans back to work. The House last week passed some provisions that Obama has pushed to aid job growth. But it didn't include new tax breaks for small businesses that hire.
The administration credits its $787 billion package of tax cuts and increased government spending with improving employment, though Republicans argue it did not help much.
Range
Look at this range bound market-Geez- One thing for sure it will soon break and get a nice move


Monday, December 21, 2009
Gold
Posted a few weeks ago when we hit Gold 1200, that I would not be long here before a pullback. Since that we have gotten our pullback and Gold is now trading around 1096. I think the important number is 1076 BUT it is possible that we could retrace back to 1045 area before we continue higher.
These last day of the year movements are usually just window dressing and tax related trades. Remember last year what happened, we made our usual January effect movement then we had that awful drop beginning in Feb to the March lows. This time we are above those relative levels but I would be looking for the same pattern to mirror itself during the same time period.
These last day of the year movements are usually just window dressing and tax related trades. Remember last year what happened, we made our usual January effect movement then we had that awful drop beginning in Feb to the March lows. This time we are above those relative levels but I would be looking for the same pattern to mirror itself during the same time period.
Holiday week
Folks remember this week is done a matter of fact the year for most. It will be easy for the manipulators to push around stuff as this week is a 3 1/2 day week and added to the fact that most firms have said they are protecting their profits since summer and are virtually out of the market since September for the rest of the year.
Sunday, December 20, 2009

Friday, December 18, 2009
Triple expiration today
Friday is the last Quad Witching of the day. OE days in general tend to be high volume, and this should be no exception. The real question now becomes will there be any volatility or will it just be a limp like day.
I guess I got that low yesterday dead on. Nothing like when technicals work to a T :)
Still the same setups for today since we have been not changing any structure.
I guess I got that low yesterday dead on. Nothing like when technicals work to a T :)
Still the same setups for today since we have been not changing any structure.
Thursday, December 17, 2009
45 minutes to go
Hmm very interesting action although the volume is low. It would be noted as a weak session if we definitely break lows of day into close from here.
Below 1093
Below that 1093/1092.50 area the next real decent level of support is 1079/80. Not that we reach that today but if we close below the 1093 the next area of substantial support is there.
One hour in I am pretty surprised by the action.
1092.50 might be a buy with a stop around 1090
One hour in I am pretty surprised by the action.
1092.50 might be a buy with a stop around 1090
Thursday
Looks like we will gap down today bu I doubt we sell off today. I would be looking at 1095 as a line in the sand if we get that low. I am actually looking for us to get a nice bounce but we will see how we digest all the news coming in this morning.
Wednesday, December 16, 2009
Fed out
With the FED out of the way I think the seasonality of the holidays kick in and we head higher. It is pretty much dead out there volume wise so it would take nothing for them to move us higher.
Remember too we have expiration this friday. Most are already trading January options and March futures.
Remember too we have expiration this friday. Most are already trading January options and March futures.
FED DAY
Fed day today so I except very low volume till the announcement. Does this leave us clear to edge higher into a Christmas rally? We will have to see, take note of that 1121/3 area as this is the 50% retracement area of the all time highs and the March lows. That area will act as a magnet here on the upside though ultimately we could head higher.
Remember we could go any way here and 1200 is not out of the picture if the signals turn up. If we can't break up on volume we will put in another narrow range divergence and this would make it 5 in the consolidation range.
Remember we could go any way here and 1200 is not out of the picture if the signals turn up. If we can't break up on volume we will put in another narrow range divergence and this would make it 5 in the consolidation range.
Tuesday, December 15, 2009
Fed Tomorrow
Should be another no action day till 2:15 when we get the decision out. Who knows what will happen but a likely outcome is a ramp up after the announcement to the marginal highs then and retrace of it all. I am kind of looking at this move because that has been the trend for the last few meetings but we will see.
Market is still in a comatose state here.
Market is still in a comatose state here.
BAC
Keep an eye on that important $15 level for BAC. Looks like it will definitely break soon. On that note all the banks are running to payback the TARP why? Really they are so full of greed for their upper management bonuses they aren't thinking about the long term.
Who am I anyways!!!!!!!, heard the BAC also now looking internally for a CEO, wow I would feel like crap knowing I was working at a company and I was the last one to get offered a job when all possible external candidates didn't want it, this is just funny.
I would say alot more about the banks like I use to but I don't want to get hate mails again. I bet when we do our wave 3 down I will get them saying it is me- :) funny too funny. I do this blog for fun and to keep myself sharp when I loosing mojo on my analysis.
Just be glad if you are healthy and can help yourself. I knew quite a few people who passed on this year, one just one month older than myself and many people who were in and out of the hospital, one as recent as last night, so be joyful if you are up and around and healthy.
MARKETJEDI
Excitement
Yep another exciting day yesterday NOT! I guess we are just winding down for the rest of the year. I have never never seen this in my over 12 years of trading but there is always a first. Today tuesday should also be very boring with the FOMC meeting starting today and decision tomorrow most will just be out shopping :).
I guess after the announcement we will get a directional move and I am guess up but who knows, it is all a guess here till be get some momentum out of this chop.
I guess after the announcement we will get a directional move and I am guess up but who knows, it is all a guess here till be get some momentum out of this chop.
Monday, December 14, 2009
No updates today
Have some appointments to deal with today, so I will be away from the market action. But here is a small note.
The only thing that makes me interested in the equities market here is our time cycle calculations longer term which showing some clear cycle top, coupled with the obvious technical negative divergences. Balancing against all of that the trend from S&P 865 or even more clearly the March low of 665 is obviously up and the subsequently larger cycles have up peaking in 2010 of the rebound in the bear market. We must remember simple charting 01, consolidation near the highs ‘should’ lead to a move higher.
It should be very interested here as we could make a marginal new high, personally looking for an area 1122-1134 and then we collapse which has a very high probability of happening.
Friday, December 11, 2009
Non-Eventful day again!
I have a feeling we will just do what we did last year this time get a low volume swing up and then die after the first few weeks of January. All I know nothing is happening here equity wise and the real movers seem to be the Gold, Silver and Oil.
Makes no sense putting up charts because they show nothing but consolidation and chop and I don't have to say it, its obvious.
Banks are looking interesting and why I say that is they were the big leaders off the March lows and they seem to have lost stream in the last two months so I conclude this is a very important development.
Oil been sweet if you caught it short I said it before a break of $76 points to lower prices and that was what happened. Also the seasonality factor of Crude Oil made it negative coming into the later weeks of the year. Check out natural gas that one is always good this time of year but I totally had my eyes elsewhere and didn't make an alert out of it.
Have a great weekend
Thursday, December 10, 2009
Keep eye on Banks
Keeping eyes on Banks with all this TARP payback. My benchmark is still BAC $15 level
Citibank
Citibank paying back their which is great but to do this they have to issue $200 Billion in equity. Seeing all these banks rushing to pay back the TARP let me think they are doing it at the expense of capital dilution. We will see what really happens. In the mean time 1123 on the upside is the number I have and 1087 on the downside.
Seasonality is in place here folks and don't forget that. Usually they try to push up into mid December then we drift down during the final days, obviously this could be distorted this year due to the anemic volume.
Seasonality is in place here folks and don't forget that. Usually they try to push up into mid December then we drift down during the final days, obviously this could be distorted this year due to the anemic volume.
Wednesday, December 9, 2009
Boring
Nothing boring day and indecision. Only significant happening was that my good old Bank of America paid back the TARP funds. Now they are free to rape us without a cause and get a CEO. Watch that stock as I have been saying $15 is the magical number on it. Has to hold that level or we will quickly wee $12. No doubt it will be in the single digits next year in my opinion but the market is doing much here to push the financials down yet.
Do I ??
Do I get to say BINGO today again with a 1081 hit????
We will see maybe we get there overnight and I wouldn't be surprised at that.
We will see maybe we get there overnight and I wouldn't be surprised at that.
Drip
Wonder if they get to 1081 today or overnight. Another thing, has anyone notice that the days are boring while the action is 90% happening overnight. Yes not alot of participation for U.S players.
downside
Downside number I am looking at for some support is 1080/1. I still believe we will mismatch till the first week of January with a slight bias to the downside into Christmas
Tuesday, December 8, 2009
Wedging
We are so forming a wedge on this higher band. That is a sign of struggling of the last trend, so do we get a meaning full pullback here? Maybe remember also the 50% retracement is around 1024-26 area.
Again is bears need to get us below 1084 to really make there stand
Again is bears need to get us below 1084 to really make there stand
Monday, December 7, 2009
Monday
First Monday we have struggled to be in the green in a long time. I do have a cycle peak around here so that could have given credence to the lackluster day. Also remember we are going into the seasonal time of the year. Traders seem to have taken off the rest of the year since October when most managed to get back in the green from horrible start to the year. That's the main reason why volume has been extremely low since September, no one wants to gamble and most are just holding out to close the year positive. Might prove to be a worthwhile move.
Computer fixed
System is back up and running. I just need to call my software providers today to reactivate my program and I am good-
I will see if I can get them up completely before the first hour of the market open.
Will be back later
I will see if I can get them up completely before the first hour of the market open.
Will be back later
Friday, December 4, 2009
Hmmmm
Seem to be working now- I will test during the rest of day and tomorrow and post some thoughts and charts up for next week.
I hope it is fixed- rrrrrrrrrrrrg- Bill Gates you scum
I hope it is fixed- rrrrrrrrrrrrg- Bill Gates you scum
Sorry folks
No updates yesterday as I have a serious virus on my trading system. Bill Gates why can't you make a decent OS, just crazy.
I guess I will be working to resolve it today once again.
In the meantime today is job numbers we will see how we really react on this one, we are in one boring market here
I guess I will be working to resolve it today once again.
In the meantime today is job numbers we will see how we really react on this one, we are in one boring market here
Wednesday, December 2, 2009
DOJI
So today once again a boring day and marking a DOJI on the day. Folks the market is at a stand still except for that GOLD :) I am looking at my charts on Gold and it is very possible for it to move to 1280 area easily but wow can we get a rest or a pullback to jump on?
Silver is also on a march upward and that look like it will hit that $20 mark again very soon.
This evening Bank of America said they would repay $45 Billion of the TARP by raising $18-19 billion of fresh capital and cash on hand. Funny didn't they just lose billions in the last quarter I have to check but it seems a desperate move on Bank of America to try and dispell fears they are not on strong grounds and thus the problem of the difficulties of finding a new CEO. Hello BAC, do you want my resume? I will work for free, just want a bonus :)
We will see how that works out in the market but I fear after it is all said and done it will be negative for the stock price. $14-15 is a very important area for that stock and a break of that area would send it easily to $12. What I am going to say here might sound crazy as usual but I honestly believe all these banks want to pay back the funds because they aren't making money. Sound crazy? nope and I will explain. When the TARP is paid back they are no longer under the eye of the government and therefore once again can go after those high risk products that really makes money. Right now they have to play it safe and playing safe means profits are slim and in most case declining, that's why they are raising fees all over the place on consumers. Yep sound crazy but it is the nature of Wall street, GREED rules! not risk management. That's one of the serious flaw of being overly capitalistic, greed takes over and we throw caution to the wind..
Gold Again
Nothing seem to be stopping this engine from revving. Watch the 1101 level on the S&P today, must hold that level for the bulls.
Side note I have been working on some new stuff and I have been fine tuning projections with time and price for more accuracy. Using previous projection we still have a projection to the 1145 area for the S&P.
Side note I have been working on some new stuff and I have been fine tuning projections with time and price for more accuracy. Using previous projection we still have a projection to the 1145 area for the S&P.
Tuesday, December 1, 2009
Range Bound
We have been in a range bound market for the last three weeks. The range has been 1086-1112. Believe it or not put up a chart and look at it almost impossible to do anything. A 25 point range for week is just ridiculous and I wonder if it could remain this boring for the rest of the year.
Gold
http://www.businessinsider.com/as-gold-hits-1200-china-prepares-to-increase-its-holdings-significantly-2009-12
S&P Silverblatt
Just read Silverblatt noting this decade will be the first decline in the market ever. They are also claiming a Dec 2010 target on the S&P between 980-1100 so basically falt from these levels. Very interesting indeed
Citibank cautious on Banks
(Reuters) - Citigroup said there are substantial risks facing U.S. bank stocks now, but in the near term these stocks can grind higher given a combination of the Federal Reserve's accommodative stance plus a modest recovery.
"Since there is above-average risk, we would remain very selective focusing on banks that have strong capital positions, while avoiding banks with the combination of relatively high commercial real estate exposure and questionable capital strength," Citigroup said in a note.
The brokerage upgraded BB&T Corp (NYSE:BBT - News) and Fifth Third Bancorp (NasdaqGS:FITB - News) by a notch to "buy" and kept Bank of America Corp (NYSE:BAC - News) as its top pick among U.S. bank stocks.
Citigroup analysts, including Keith Horowitz, also kept their "sell" rating on the shares of Zions Bancorp (NasdaqGS:ZION - News).
The analysts are also upbeat about the shares of Suntrust Banks (NYSE:STI - News), while they see the least value on Regions Financial (NYSE:RF - News), KeyCorp (NYSE:KEY - News) and Zions.
They estimated that banks in their coverage have crossed 55 percent of the credit cycle, though M&T Bank (NYSE:MTB - News), Comerica (NYSE:CMA - News) and BB&T have most losses ahead.
Banks with excess capital will be key players when the credit cycle is over, giving them a chance to take advantage of opportunities such as acquiring weaker players and organic loan growth, the analysts wrote.
Gold
Gold January contract traded 1199.6- Hmmm I would call that $1200. Important to watch Oil here to and see what it does out of the structure. Structure has been consolidating but would more seem to be signaling higher.
Charts will be back up tomorrow
Charts will be back up tomorrow
Gold
Gold went $1 within the $1200 target. I read people saying Gold should be shorted, I really don't think so I would rather trade it long with stops below the last swing lows because this seem like Oil last year.
Areas to watch
Some areas to watch for the rest of week. 1097 on the upside the bulls need to clear this to get a foot down on the bears. The bears need us to break 1081 and spike down to that 1065 to change the sentiment. Main problem we could just trade in this range for awhile for complete boredom
Monday, November 30, 2009
Still thinking
Still thinking we drift higher especially the first week of the month and then slowly lower into the christmas holidays. We are definitely in wait and see mode still so forgive the boring updates :)
Well we knew it would happen
The Federal Reserve is taking steps to fine-tune a strategy to reel in some of the unprecedented amount of money that's been pumped into the economy during the financial crisis.
The Federal Reserve Bank of New York said Monday that investors and others shouldn't read anything about the timing of when the central bank will need to reverse course and start boosting interest rates and removing other supports to fend off inflation.
The upcoming operations will involve so-called reverse repurchase agreements. That's when the Fed sells securities from its portfolio with an agreement to buy them back later.
Reverse repos are one of the tools the Fed can use to drain some of the money it has plowed into the economy to ease financial troubles.
The operations will be "extremely small" and won't affect the Fed's key interest rate, officials said. They wouldn't say what the dollar amount for the operations would total.
Fed officials also said they didn't know when the first operation would be conducted and how many there would be. The operations will be conducted to "to ensure operational readiness" at the Federal Reserve, the New York Fed said.
They do not "represent any change in the stance of monetary policy, and no inference should be drawn about the timing of any change in the stance of monetary policy in the future," the New York Fed said.
Reverse repos have been in the Fed's toolkit for years as a way to mop up money in the economy, and most recently were used in December 2008, the Fed said.
This time around, though, the Fed is considering selling its securities to a broader set of investors -- beyond the traditional big "primary" securities dealers such as Banc of America Securities, Citigroup Global Markets and JPMorgan Securities.
Fed Chairman Ben Bernanke has said such large-scale reverse repurchase agreements can be done with banks, Fannie Mae and Freddie Mac and other institutions. Some analysts have said that might involve transactions with money market mutual funds.
To foster the recovery, the Fed earlier this month decided to leave a key bank lending rate at a record low near zero, and pledged to hold it there for an "extended period." Many economists predict rates will stay at super-low levels through the rest of this year and into part of next year.
The central bank's balance sheet has ballooned to over $2 trillion -- reflecting the special programs it has set up to spur lending, stabilize banks and revive the economy. That's more than double the amount from before the financial crisis struck.
One of the biggest challenges for the Fed is deciding exactly when to start boosting rates, and when to remove economic and financial supports.
Remove the supports too soon and the recovery could be derailed. Leave the supports in place for too long risks unleashing inflation.
From Yahoo Finance
New lows
New lows printing on the day- Still action is cloudy, seems a lot of persons are still having pumpkin pies
New week but end of month
Let's see how the traders come into this week. Hard to call from here with the 3 day holiday last week. So will update when some patterns form
Sunday, November 29, 2009
Friday, November 27, 2009
Futures WOW
I didn't realize the futures were down as much as 40 points and 400 DOW points. Need to take note of those points
I love saying BINGO
Notice what happened to GOLD hit the C point of our charts and bang that was it. Yes we had the news hit overnight with Dubai but let me reiterate this news doesn't not make technicals and it would have played out that way anyways.
Now lets see what happens to this gap down remember it is a half day and it seems we have already touched some important levels I had marked down on the lower end.
Today is usually an non event day so don't really expect much to really manifest itself with the Dubai news but it just shows you the world is still a fragile place.
MARKETJEDI
Thursday, November 26, 2009
Holiday post
WORLD markets are in heavy declines as there seem to be trouble in the once promising Dubai.
Dubai Investment is said to be on the verve of default.
Is this the trigger of wave 3????
Dubai Investment is said to be on the verve of default.
Is this the trigger of wave 3????
Wednesday, November 25, 2009
US Dollar
Been writing about this forever and folks aren't fully realizing what is going. The crushing for the American PESO :) been talking here on the blog for months about folks will tell you about the DOW being over 10000 (meaningless argument) and things are looking up BUT when the value of the currency is declining at a faster rate of your investment returns you are loosing REAL wealth. Can you guys imagine if something happened globally and US debt holders would have to sell lets say 15% of the debt, if you think the dollar is slowly getting crushed now pray you don't see such an event.
The news here is the dollar and nothing else, that's the reason why the FED is keeping rates low. They are hoping its spurs some investments in productive areas but sadly it is not. I have no prediction on this dollar sinking more than I saw it years ago coming to this because the escalating deficit. We are now $1.15142 for the Euro and remember it was at these level before we had that steep market sell off to the March lows..
Have a great Thanksgiving.
Bingo on Gold
Gold has finally hit it ultimate projection C point. I would be cautious here and out any long position here as we should get a rest point here.
Aren't technicals great!!!!!!!!!!!
Aren't technicals great!!!!!!!!!!!
Thanksgiving
Hope everyone have a peaceful holiday weekend.
I am doing some reading and see alot of people are full blown SHORT right here but one thing I will point out is that although we know that we are still in a bear market the market can remain irrational for a long period and kill you.
I rather wait till we get the signals that we can go full short and then execute, believe me missing a week wont kill you. The market wont drop from 10500 to 5000 in a week! there will be enough time to get on board. Just right here and now we are in chop mode and it is dangerous to pick a real medium term swing position without clarity.
MARKETJEDI
Tuesday, November 24, 2009
Low Rates
After a period of low rates in the Greenspan administrated FED we created numerous bubbles, the internet and housing bubble the two main ones. My radar for the last couple of months have been on the same with the new leadership at the FED.
I know the FED crosses a line of political ideology many times but this is exactly what I fear with extended period of low rates, more bubbles. Today @ 2pm the FED released their minutes from the last meeting and I was in shock. I will let you all know this very few people analyze the FED minutes as it is seen to them as backward looking BUT FED decisions are main to influence future actions. So when the FED change rates it takes awhile to filter throughout the system and see its effect that's why more should analyze these FED minutes.
Two important points of the FED minutes. First the FED explicitly said the economy will not be fully healthy for listen this another 5-6 years! Now that puts me on very cautious ground if I were a CEO of a fortune 1000 company and I would be inclined to continue to cut cost mainly through outsourcing and expansion. Secondly, that rolls into the second point that the FED touched on that of continued double digit unemployment.
I have said it time again, US is going the way of Europe not because as the right would put it we have elected a socialist government but on the contrary we are too focused on Wall Street on profit and not on the human toll on our society. I dont think we will ever see 5% unemployment because we are in a new phase economically where that will just be impossible. I must emphasize 100%, I real unemployment is around 17% and I think many will agree with me.
I hope the capitalists will find it in their hollow heart to change their focus for once of the betterment of the society and not just their pockets, in the mean time housing prices are still going down (1 in 4 mortgages are underwater), Gold is marching higher (8 straight days higher) and the US Dollar is still getting cracked.
Gold article
Gold is soaring, hitting new record highs almost daily. This C rise is going strong. Our initial $1200 target level for this year's rise has nearly been reached, but gold could go higher.
This is good news for all of us who have been invested in gold for the past eight years. But even for those of you who invested in more recent times, gold has been a good and profitable investment.
We feel strongly that this will continue in the months and years ahead. And there are many valid reasons why.
Most important, the unprecedented monetary policy currently in force is inflationary. The same is true of the weak U.S. dollar, negative interest rates, rising oil and commodities. Gold buying by central banks is also boosting the gold price higher.
Even though gold is still relatively unknown in mainstream investment circles, it's starting to attract some attention. As this interest grows, momentum buying will pick up and the exchange traded funds are another big positive, simply because they make it easy to buy gold. The improving economy is another positive factor.
SOME CALM AFTER THE STORM
Yes, there are problems.... serious problems. But that doesn't mean the world is going to fall apart next month or next year.
Pessimists are always going to paint the worst case scenario. Optimists will forever present the best case scenario. The reality is usually somewhere in between. But the markets and the facts always tell the story and that's what we try to focus on. So what are they currently telling us?
First, despite all that's happening, it's important to put things into perspective... and looking back, the overall situation was a lot worse last year compared to how it is now.
Remember, the entire financial world was on the verge of collapse last year as one huge company after another failed, or came close to it. Economies worldwide were dropping and so were all of the global stock markets. Fear and panic were rampant, and with reason. The crisis wiped out a greater chunk of household wealth than during the Great Depression. No one knew what to do...
Now fast forward to today...
For starters, nearly every economy in the world is growing, some obviously more than others. But the point is, they're all up. Stocks around the globe have also been rising this year and confidence is returning.
In the U.S., for instance, the economy grew 3½% in the third quarter. The leading economic indicator has been up for seven consecutive months and stocks, which lead the economy, have been rising for eight months. Manufacturing is on the mend, along with other important economic signs, all showing that the recession ended in June and the economy is now on its way up, albeit slowly.
In other countries, growth has been far more robust. In China, for example, the economy is growing at a 9% rate. So Korea is growing at the fastest pace in seven years. India is going strong, the same is true in most of Asia, Brazil, and to a lesser extent, Europe is improving too.
2009: Great gains
So far, based on 18 of the world's major stock markets, the gains this year have ranged between 11% and 92%. The average has been 31%. So even though the Dow Industrials is only up about 14%, the global stock markets are all telling us that ongoing growth lies ahead.
Since the markets look to the future, if that were not the case, these markets would be falling, not rising.
Okay, but what about commodities? The CRB commodity index has gained 24% this year. More impressive, copper has soared 101% and it's known as the global economic market barometer.
Oil has also surged. It's gained 75%. Very simply, if these two key commodities were not in big demand due to improving world economies, they wouldn't be rising the way they are. Instead, they too would be falling.
The main point is... these are not signs of recession and they're certainly not signaling a depression. In fact, they're telling us that deflation is not currently a concern.
On the contrary, these rising prices are more indicative of inflation downstream. That's especially true considering the weak dollar.
HOLD GOLD
Again and very simply, in a healthy economy annual deficits shouldn't be more than 3% of GDP. Once this percentage exceeds 5-6%, the currency of the country involved historically falls sharply.
Currently, this percentage has soared to about 10% in the U.S. and unfortunately, that pretty much puts the nails in the dollar's coffin. This alone will propel gold much higher.
These are the key reasons why we continue to recommend buying and holding gold. Whatever the ultimate, longer-term outcome, it's pretty clear that the situation is going to intensify and as it does, gold is going to be the main beneficiary and its bull market will endure well into the years ahead. That's been the case for thousands of years during times of economic uncertainty and gross imbalances, and it's now happening again.
Note that gold rose 56% and 58%, respectively, in the last two C rises (see Chart). So far, gold has risen 32% in the current C rise. Plus, its leading indicator still has room to rise further before it reaches the temporarily "too high" area. Since this rise is powerful, the gains this time around could be similar to those in 2006 and 2008. And if they are, gold could continue up to near the $1350 level before this C rise is over.
We'll be watching closely but for now, hold on to all of your metals related investments. Silver and gold shares are also surging, and so are most of the other metals. Silver is at a new 16 month high and it too is approaching our first target area. Gold and silver will both remain super strong above $1070 and $17.20.
This is from a printed article
Monday, November 23, 2009
trend
Seem like we having a new trend of gapping up on mondays and not looking back. Look for tuesday for us to pull back and test the gap left over from today. Not much to report on with these gap and go type of days with little volume.
On another Robert Prechter said to his readers that you should be short for the long term here because this is all BS. I am just reporting what I read I am not making a recommendation whatsoever but you all know Prechter is such a mentor for me.
On another Robert Prechter said to his readers that you should be short for the long term here because this is all BS. I am just reporting what I read I am not making a recommendation whatsoever but you all know Prechter is such a mentor for me.
Early monday
Folks remember this shorten holiday week is usually an upward biased week so take careful note of that trend.
Gold off to the races again.
Gold off to the races again.
Sunday, November 22, 2009


Saturday, November 21, 2009
Markets Update

We are in a difficult period to gauge what we are doing structure wise in the markets.
It's just one of those situations where we won't truly know what structure has traced until after the fact, which is not uncommon to most technicians.
It makes it hard for position traders, and to some extent, swing traders like myself to position a solid trade due to the tighten ranges here.
The 15 minute pit session chart shows an island reversal. This is basically an exhaustion gap that is followed by a breakaway gap in the opposite direction.
I am counting the move off the 1112.25 H as a 5 wave structure. You could argue for a 3, but I think it should count as a 5.
This implies that after a retrace process we should see an additional 5 waves down, at minimum.
It appears that we have 5 small waves up from the 1085.25 L, which I have labeled as a sub-minuette degree a or i.
Drilling down further, we can see that it appears that micro [A] is complete. We should get a small [B] retracement (levels on chart) when globex opens, followed by a [C] leg lower.
At that point, I would expect to see a 5 wave structure higher of sub-minuette degree.
Any trade through the 1085.25 L would invalidate this view.
The weekly view suggests that we should see additional downside pressure on price.
This past week saw price action fill the long standing gap from October 08.
Also to note we had a cycle high due and a new moon which usual signals a reversal in the market. All this suggests we may see lower price, though never a certainty.

Friday, November 20, 2009
Soybeans

A breakout week for beans. Price traded through the 1029.50 H, and more importantly, the 1041.50 H.
This more than likely signals that primary [C] of a double zigzag of cycle c has commenced.
There is still an outside chance that we are still tracing primary [B], though I believe those odds are low.
Upside targets are where (3) = (1) at 1100.50, and (3) = 161.8% of (1) at 1192.75. [C] = [A] at 1174.
Drilling down intraday, you see that price is having a struggle getting past the 1050 level. This happens to be the 127.2% expansion of (2), which does get my attention, but my guess is it will be short lived as resistance.
Bottom line - It was sort of a messy start to this leg, but things appear to be progressing in impulsive fashion. I am near-term bullish this market until proven otherwise.
Wheat
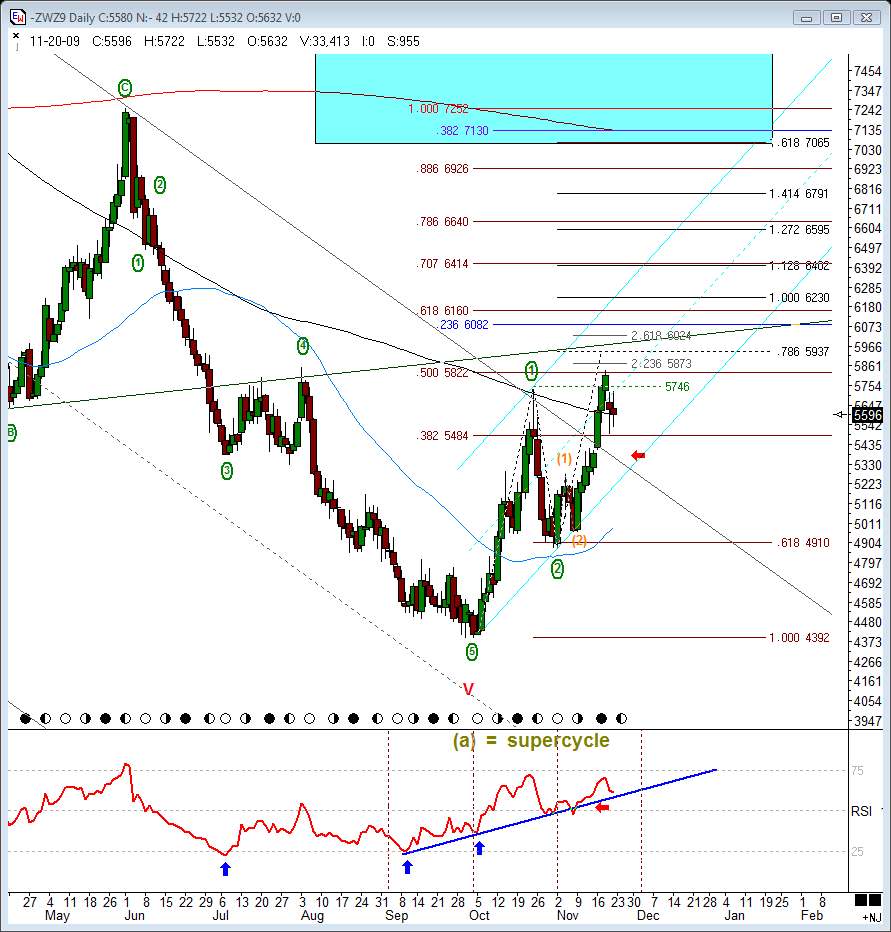
Big breakout week in the wheat market.
Price confidently traded through the primary [1] high, suggesting that primary wave [3] was underway, and more specific, a "third of third."
The alternative is that [2] is still tracing and this is nothing more than a (C) leg on a coke binge.
I believe this little pullback is nothing more than a smaller degree 4 wave, possible of minor degree, though it may very well be intermediate.
Since we have decisively broken out of the down channel, we should expect it to become support if price were to trade that low.
Notice how price has supported on the 200 sma after breaking through.
Upside targets include [3] = [1] at 623.25, and [3] = 161.8% of [1] at 706.75.
Bottom line - I am near-term very bullish this market. Any trade through the intermediate (1) H of 528.25 would quickly change this view.
BINGO
Bingo on the 1083 support- Today is option expiration and that means it is day off for me. Most manipulated day of the month for trading and it makes no sense to even look at a day like today..
I would love to see this range expand, it is impossible to trade a narrow range.
AGAIN WATCH 1075 IF WE BREAK 1083 TODAY
I would love to see this range expand, it is impossible to trade a narrow range.
AGAIN WATCH 1075 IF WE BREAK 1083 TODAY
Thursday, November 19, 2009
Recovery
Where is the great recover the talking heads talking about???
AOL just announce they laying off 1/3 of their workforce
AETNA had lay offs yesterday.
Again where is this great recovery and new bull market
AOL just announce they laying off 1/3 of their workforce
AETNA had lay offs yesterday.
Again where is this great recovery and new bull market
Action
Funny how the patterns are saying higher but the volume as we have noted just won't back up the patterns. That's why in those circumstances you stay out of the way, this is just too choppy either way to take a stand.
Next support 1083 then 1075
Next support 1083 then 1075
Action
Very interesting action early- Remember to bracket the first hour range and see where we break
S&P
man what a mess!
Another choppy day yesterday the bulls defending 1100 once again on the S&P 500 Futures, but the futures are below that level overnight. A late day grind brought the futures out with a slight gain on the day.
The market appears to be gasping for water, but it does not appear that the bears want to risk much trying to put an end to this upside. The E wave count suggests we should get one more push up here (how many times are we going to say that:)), but as I said before, we are in a cycle confluence along with a structural resistance zone, so a pullback from around here has good odds, which I said last week, but the obvious depth is the big question.

Wednesday, November 18, 2009
Level on the Upside
S&P 1121 on the cash is a 127% Fibonacci external retracement number and should be resistance point and next target for the technicians.
Also watch 1098.50 on the downside
Also watch 1098.50 on the downside
Tuesday, November 17, 2009
Great action
Great action for a boring day !! Why do I say this? today is a consolidation day but I am seeing some patterns that are signaling higher yes higher. I am out of this action because of the volume but patterns never lie.
Oil also looks like a bull flag but the question is whether it needs to develop the structure more before it moves high.
Gold geez what can I say - years ago I remember telling people gold would goto $600 when it was 250, which I owned that from $250 :) but such is life.
Oil also looks like a bull flag but the question is whether it needs to develop the structure more before it moves high.
Gold geez what can I say - years ago I remember telling people gold would goto $600 when it was 250, which I owned that from $250 :) but such is life.
Monday, November 16, 2009
Sugar and OJ
Wow these commodities have been on fire. Sugar has double since January and Orange Juice is up 68%.
WOW
WOW
Something interesting
Alot of people are looking for a top but this is dangerous. This morning on CNBC Gartman proclaimed he is out of the market because last month at lower levels they thought stocks were overpriced. The point here is that's why the volume is low because the smarter guys believe prices are such.
For all my years trading I have learnt not to look for the exact bottom or the exact top IF you believe we are close to a bottom or top stay out till be get the turning point and confirmation there will be alot of time to profit from a reversal.
Good trading today folks and I would be shorting this gap up at least for a trade.
MARKETJEDI
Gold
Gold is again making new high- Seems like the folks who want 1500 on Gold will get it, who knows!
Saturday, November 14, 2009
My thoughts
I have been on and off this week due to a personal matter but I told myself I would take 3 hours today to do some homework so readers don't think I deserted them. I posted updates for crude, bonds, dollar, corn etc but I would like now to address the indexes.
It has been tough trading the indexes for the last 3 months but one thing to always remember is that the market follows trends. The trends of earnings runnings and the seasonality of the market must never be underestimated.
Although we have screamed much since March 09, we are moving on much lower volume with negative divergences on all technical parameters like breadth. There is a high possibility of a peak here BUT not the peak in this bear market rally, YES BEAR market rally. After doing some initial work, I have some target about 90 points higher here on the S&P. Do we get there, possible but I would be shorting there 1000% if we hit 1172/8 area. We need to remember here folks that although it sounds and looks good that the market is grinding higher we must look at the technicals and fundamentals of the markets and that of the overall economy. Big money are all viewing this is a bear market and to be honest it is! just look at the earnings, etc, they are terrible. If you really analyze it, the S&P is now more expensive here than when it was 1300, believe it or not! and the value of the almighty dollar does make the scenario any better.
Now how will it play out? Hmmm only a guess here but I would love to see us make a technical high here in the next few days and then get a pullback below that 1025 low we did recently. What that will do is shake out the weak longs and then we would amount another rally maybe in the Spring to higher highs. After that I would definitely looking to short and when I say short I mean big time no holds barred as this would be the start of the great bear wave 3 in my opinion, which will blow investor's confidence out of the water.
Folks the banks are not performing here. I think one of the real big banks are going to suffer huge losses in the next 6 months and I have my bet on two in particular but I will update on them later. Remember Wall Street want to cash in on their bonuses so don't expect us to crash and burn before end of year it WON'T happen. They need to keep the musical chairs running to collect from the dump mom and pops investors.
I would sit on my hands if I were a long term investor in equities here. I would be very very cautious here.
Crude

The crude market corrective continues. We have now registered 17 trading day's in a sideways market.
Although this chop has been difficult to discern from a pattern standpoint, it has been very tradeable with plenty of range.
We show a simple (a)(b)(c) , though it's possible we are tracing a combination.
We have broken free of the 20 sma and appear headed for a meeting with the 50 sma, which is at 74.57 and rising.
Conclusion should see one more leg down to complete the structure
Dollar

New Lows in the dollar again. It appears that we had 5 waves down off of the spike high of 77.50. If it is a minute degree, structure would be complete. Any degree less, argues for a 1st wave.
Conclusion we will see more new lows
Gold

The gold market continues to subdivide higher, reaching new highs in the process.
It's apparent that we are getting very close to this leg finishing. I am assuming that this will complete a minute degree wave [v] coming out of the triangle. Remember that triangles precede finishing moves.
If this interpretation is correct, we will complete an intermediate degree (B) wave at this moves conclusion.
I am anxious to see what type of price action we get when this leg finishes subdividing. Whatever it completes should be tradable.
Sentiment continues to maintain over 90% bulls according to the DSI readings.
Bottom line - We keep going up until we don't. If I were long, and I'm not, I would use Friday's low as a stop and perhaps trail it up.
Corn

The corn market traded higher this past week after retesting the broken channel.
I interpret structure to still be tracing intermediate (4) of primary [A].
It's possible that wave (4) has completed and (5) has started. I don't believe this is the case though.
Being a 4 wave, there is always the chance of a triangle or some type of complex pattern.
Should (4)'s price low be in, we can start to get upside projections. (5) = 61.8% of (1) - (3) at 428.25.
RSI has done a good job of maintaining its uptrend line. We should expect to see our customary divergence when (5) completes.
A critical level remains the price extreme of (1) at 347.60. Should price trade through that level, then we would have to take another look at structure.
Bottom line - I'm expecting some more grinding away in this wave (4) this upcoming week.
Soybeans

The bean market traded higher this past week after bouncing off the daily 50 sma.
Interpretation remains intermediate wave (2) of primary [C] of a double zigzag cycle b wave.
Price action off the 951.25 L does not appear impulsive. This suggests that (2) needs additional work. Should this be the case, the channel will be in jeopardy.
The 880.25 L is a critical level. Any trade through this price invalidates this leg being a (2).
A triangle may still be in play, whether an [X] or [B].
The retracement levels of (1) are on the chart.
Bottom line - It appears that wave (3) will need to wait a little longer. I'm expecting downside pressure for the upcoming week.
Wheat

Wheat market enjoyed nice upside price action this past week.
Interpretation of the structure is an intermediate (2) of primary [A].
It is unclear if we are still tracing minor B of (2), or if wave (2) has actually completed. My guess is that we are in the finishing stages of minor B , with C down to follow.
The alternative is that (2) completed at the 487.75 L and we have put in some smaller degree 1's and 2's.
Notice that we are back at the channel. This would be a good spot to complete B.
Any trade through the 574.75 H would signal that (3) has commenced.
The dotted vertical lines in the RSI pane represent Gann dates. The last 2 have been spot on for very tradable lows. The next date takes place on December 2nd.
Bottom line - I'm expecting price to start retracing very soon. The retracement levels are on the chart.
Friday, November 13, 2009
S&P
Obviously a double divergence on the MACD as of yesterday, but unless we get momentum and volume that confirms the downside pressure, this pullback must once again be looked at for a buyable dip. NO!!!!, I AM NOT SAYING IT’S A BUY HERE! I am saying that unless we see something different than the recent pull-ins we have seen, then we should not fight the trend. No, I haven’t changed my big picture view which is that we are in a BEAR market, but looking for the end of wave 2 and the start of wave 3 has been a futile effort for the bears so far. If we are indeed about to start wave 3, there will be plenty of opportunities to get on board once it starts. The obsession of getting in at the beginning can cause much more harm than good to your port.
Anyway, I’ll be watching an early push up for a retest down to Thursday’s lows at a minimum, with the next support line at 1074 basis the S&P Futures. if we gap down, then I'll be looking for a long side fade as well.
Have a great weekend
Anyway, I’ll be watching an early push up for a retest down to Thursday’s lows at a minimum, with the next support line at 1074 basis the S&P Futures. if we gap down, then I'll be looking for a long side fade as well.
Have a great weekend
Wednesday, November 11, 2009
Same old story
Folks keep on watch the meaningless DOW and mean while the real story is staring them in the eye. Gold fresh new highs and the US dollar at a 15 month low. The low prolonged interest rates is essentially weakening the currency as it is look upon the deep pockets as a sign of weakness that the FED is not willing to raise interest rates.
Gold is up almost 30% year to date and that's nothing to sneeze about and is outperforming the market over the last 5 years at a rate of more than 10 times.
We will see what happens but I am sure this house of cards will fall. I have a family emergency and I am just popping in.
Stay light like the volume :)
MARKETJEDI
Tuesday, November 10, 2009
Busy and emergency
I dont know if I will be around tomorrow as an emergency came up today and I have to be away possible for the rest of the week. The market rally looks tired but we have been saying that for awhile with no substantial pullbacks. What I am looking at now is the seasonality of the end of year Wall Street bonus game, that will no doubt delay any deep pullback just like last year.
Very difficult to call the equities here as buying in here the risk reward is not that great, though I think we can grind much higher but I am not going to place any bets here. I will wait and see how it pans out. Gold and Oil what great movers. this year is panning out. January we were at 9000 but dived to 6600 now we are standing at 10200, what a crazy ride!
Very difficult to call the equities here as buying in here the risk reward is not that great, though I think we can grind much higher but I am not going to place any bets here. I will wait and see how it pans out. Gold and Oil what great movers. this year is panning out. January we were at 9000 but dived to 6600 now we are standing at 10200, what a crazy ride!
Monday, November 9, 2009
Gold and Oil
Look on those suckers go- I have been on the phone all morning so I have just come around-
hmmm
hmmm
Sunday, November 8, 2009
Crude

Watch crude carefully this week if we trade lower into wednesday time frame I would be a buyer- Level lower looks like 74 but I would be a buyer there. I don't think the push on the upside is over
US Dollar

he greenback had a huge spike higher Tuesday, before spending the rest of the week retracing the move off the 75.085 L.
It appears that early morning spike was a "thrust" out of a (iv)th wave triangle. If correct, the 77.50 H completed a 5 wave structure that would be labeled minute [i].
The ensuing retracement would be the wave [ii] retracement. It is unclear if [ii] has finished or not. It has retraced 78.6% thus far, a perfect wave retracement in my opinion.
Notice that RSI has failed to breakout of the 50% level once again. This has become the rock of Gibraltar.
Also notice that price could not successfully close the 50 sma.
Both of these appear to be setup to give way when we get our next 5 waves up.
The 75.085 L is a critical level for this assessment. Should we trade through that price, we obviously have something wrong.
Bonds- 30 YR

The 30 Yr failed its retest of the 50 sma, which resulted in nice downside price action for the week.
The 50% retracement level of the move off the 111-23 L, which I have labeled (X)?, supported price again. I believe this level gives way rather soon.
Equality comes in at 114-16. The minimum downside objective is 116-26.
My guess is that price wants to test the 114-26 pivot. The 78.6% retracement level is in the same area.
The bigger picture still remains unclear to me. If the 30 YR did put in an intermediate (X) wave at the 123-25 H, this would mean there is another (A)(B)(C) that should play out to the downside.
Bottom line - I still expect to see another 5 waves down of minor degree, at minimum. We will reassess at that point.
Saturday, November 7, 2009
Beans

The bean market continued with its wave (2) retracement this past week.
Interpretation remains intermediate wave (2) of primary [C] of a double zigzag cycle b wave. The primary [B] wave triangle is still my alternate view.
Drilling down intraday shows a very nice ABC corrective so far for wave (2). Price had a nice deep 88.6% retrace.
Perhaps it will want the reciprocal, 112.8% of A, for this C leg. This comes in at 944.
Other targets are where C = A at 953.75, and the 161.8% projection of A at 911.25.
The retracement levels of (1) are on the chart.
As stated last week, I am still hopeful that the channel can maintain its integrity during this retracement process. It has supported twice thus far, making it vulnerable for a break, should price reach it.
The key levels for this upcoming week include the 880.25 L, as well as the 1029.50 H. Any trade through that high will likely signal that wave (3) has begun, assuming our assessment is correct.
I maintain a keen watch of the continued RSI divergence.
Bottom line - I expect wave (2) to come to a close shortly. We should witness nice upside price action with the onset of (3).
Corn

The corn market continued retracing its leg off the 302 L this past week.
Interpretation remains that this market is tracing an intermediate degree (4) wave of primary [A].
I still have concerns about this (4) wave. As discussed last week, it appears to be tracing a zigzag. After such a deep A leg, we are left with little room for C. We did have a nice B leg up that helps.
The price extreme of (1) is 347.60. Should price trade through that level, I would have to re-think my assessment of the structure.
The 50 sma has turned up, and is now above the 347.60 level. This may possibly help support price when they meet.
Notice that RSI has reached the upward sloping trend line, which dates back to early June. This may provide support as well.
Don't forget about the "point of recognition" at the 353 level, an additional possible level of support.
C = 61.8% of A at 365.25. The 78.6% projection of A sits at 356. The 61.8% retracement of (3) comes in at 349.50.
Bottom line - Until 347.60 is traded through, I maintain my bullish stance.
Friday, November 6, 2009
Prechter
I am the biggest FAN of this guy! maybe because I am also a technical analsyst but hear what he has to say
Gold and Market
Well according to my work sometime next week should be a high. It has been very difficult the last two weeks in the market to pinpoint the cycles as we have had earnings and the FED meeting which has distorted the analysis but it should still be in the trend never the less.
Gold just running on nitro here and been talking about gold along time and it should have made it new adjusted high. This weekend I will try to see where the think will pause but we have to get cautious on Gold when the dollar start to make a rebound on it oversold stand. Also after this earnings season I will be doing my regular longer term analysis of where I see stuff in the next 3-6 months if I can.
Have a great weekend-
Unemployment rate
Unemployment rate is now over 10% again I thought the recession is over!! No folks that 10% I am telling you is so underestimated that I think that figure is more like 20%, Yes 20%. I said it many times U.S. unemployment will mirror those of the Europeans and there is nothing that can be done.
We will be looking at double digit unemployment for a long time and the government will have no choice but to implement just like the Europeans lengthy unemployment benefits. Why do you think the FED said they wont raise rates for now, they see the problems but the biggest problems is that the wheel of the economy is the banks and they are hoarding funds instead of leading it.
The FED should start it own consumer division and lend to small companies and individuals because the banks are hellbound on sending this economy in a deep end in the name of capitalism. Call it what you will but I want more over sight because it is the detriment of the economy if we don't.
Think about it one second we the consumer are paying up to 30% interest rates that the banks got at zero%, is that fair. We should stop the madness of these banks NOW !!!!!!!!
P.S. I can't believe banks were getting H1N1 vaccines when we have suffering people waiting in lines for shot, what the hell is happening to our humanity
Thursday, November 5, 2009
Boring
I guess I had a heartache for a reason, kept me away from this boring market action. Gap and go off the numbers this morning but that's it, nothing exciting, very difficult to trade a day like this.
Oh well it all can't be exciting everyday as you know.
Oh well it all can't be exciting everyday as you know.
Thursday
Waiting on the unemployment numbers but I doubt I will be doing much market stuff today as I work up with a terrible headache.
Wednesday, November 4, 2009
What I am looking at
Nothing for me today and yesterday because of FED meeting. Just watching and doing other stuff that I need to complete - Here is a 240min chart I am following


Tuesday, November 3, 2009
BINGO- GOLD 1076
Finally hit its target and actually went over so you all know what that means- higher prices are coming.
Updates
I will be busy today and tomorrow so just a heads up on the markets. Yesterday's bounce was 100% a spot to get short! What occurred the last two weeks was just our regular trend of earnings season and with most of the heavy weights out of the way we are back to analyzing the economic data.
Watch that 1023 area and below that we could head down to 1012 very quickly but as you know I am looking for us to clip below 1000 very shortly.
Right here I am totally confused by oils movement but I am sure it will resolve itself soon. Also Gold looks like it wants to finally tackle it triangle target of 1076, we will see soon enough.
MARKETJEDI
Monday, November 2, 2009
Funny
They ramped us up to +130 points on the DOW now we are only +10. If we don't bounce around here I would not put it pass us trading down to the 1022/23 level today or overnight.
This week-
Watch out for S&P 1000 this week!!!!!!!

I do believe the evidence overwhelmingly supports the case for an intermediate top being in place.
If I'm correct in my assessment, wave [ii] will be a "suckers rally." Wave [ii] completion should provide a very nice shorting opportunity, and a place to get rid of your longs.

I do believe the evidence overwhelmingly supports the case for an intermediate top being in place.
If I'm correct in my assessment, wave [ii] will be a "suckers rally." Wave [ii] completion should provide a very nice shorting opportunity, and a place to get rid of your longs.
Sunday, November 1, 2009
US Dollar

Strong impulsive upside price action for the bucky this past week.
It appears that structure has traced 5 waves up off of the 75.08 L. The question now is - has the dollar bottomed?
Though it's much to early to make that determination, everything is in place for this to be the case.
Notice how RSI tried to break out of the 50% level once again. Will it be successful this time? My guess is that it will, but it may need to pull back again to get a running start.
We are right at the upper boundary of the channel with the 50 sma directly overhead. Both of these are potential resistance.
The 78.085 L is critical support for a bullish case. Should price trade through that level, then obviously, the trend has not changed.
The 77.74 H would be the next logical important pivot that needs to be taken out to the upside.
Throwing the fibs on the impulse wave, assuming it is complete, yields targets of 77.615 (100%) and 78.629 (161.8%).
Bottom line - We should see another 5 wave move up, once the retracement process is finished, if not already. Regardless of whether "the bottom" is in, we should see higher price near-term.
Bonds- 30 YR

The bond complex caught a bid late in the week after weakness early on.
Notice how the 30 YR put in a reversal candle (bull engulfment) on Thursday, the same day we had an explosive equity market. Friday followed through to the upside, finding resistance at the 50 sma.
The lower boundary of the channel was broken, which setup a successful test of the 117-18 pivot. The 50% retracement level was in the same area.
It appears that we have a 5 wave structure down off the 123-25 H. If indeed a 5, then we know, at minimum, we will see another 5. I have labeled this leg as a minor degree 1 or part of an X wave.
Bottom line - I expect to see lower price after a retracement process.
Crude-

Strange week in the crude pits. Big reversal Thursday, followed by bigger reversal Friday.
Friday's price action confirmed my suspicion of this corrective being over.
I will keep my interpretation that we finished a minute degree [i] wave at the 81.99 H, though it is an educated guess at this point.
Support is very near with the 20 sma at 76.59. I have also placed the retracement levels on the chart.
I am considering the possibility that minor B has yet to complete, though it is a low probability at this point.
One thing is apparent, the price action off the 81.99 H is corrective - not impulsive. This suggests that we should see new recovery highs in this market once the retracement process is complete.
The dotted vertical lines on the chart are placed at the pivot lows starting with the wave (A) bottom. Notice the fairly nice symmetry between these pivot lows, though not perfect by any means.
Should this symmetry extend out to the next pivot, it appears that we are somewhere around the halfway mark currently.
Friday, October 30, 2009
Definitely got ugly
Definitely got ugly there! pushed us down to 1031. I am definitely looking at the lower numbers as the next targets to start off November.
Next important downside number is 1023 then we have 1018, which were both important numbers on the upside.
Remember when we blasted pass that 1023-1025 area it was off to the races, now that is important to watch on the downside-
Have a great weekend
Next important downside number is 1023 then we have 1018, which were both important numbers on the upside.
Remember when we blasted pass that 1023-1025 area it was off to the races, now that is important to watch on the downside-
Have a great weekend
BINGO!!
Now that one was quick- They seem to be flushing us. They got to bounce us there or it could be a very ugly close
Next level
Next level on the downside is 1037.50 for the S&P futures.
Do we get there today??????? BIG QUESTION
Do we get there today??????? BIG QUESTION
Thursday, October 29, 2009
S&P

Got to watch a strong trade through 1072. If we stay below we are turning the tide to the bears even after the move up today
Art Cashin
Art Cashin is one of the few person I like to listen on CNBC. He has over 50 years of floor experience and because of his experience he is one of the few left who have seen everything the market has done.
About an hour ago he said it was possible for the DOW yesterday to decline over 800 points (I am amazed at that) and had to really listen what is explanation was. Man he was dead on and he basically said the market is following the Euro/Dollar basically tick for tick. Art noted that any strength in the dollar will unravel us much lower which is in line to what I have been saying about a declining dollar would make market rise because of the devaluation of the dollar.
Art doesn't not believe this morning GDP numbers and I will be looking in the coming days how we really digest that number.
13 minutes in we are up but we will see how we do after lunch.
Talk to you later tonight.
MARKETJEDI
Crude Update

We have basically reached the 38.2% retracement level.
If this is a wave 4 of any degree, we probably won't get much past the 38.2% level. Should we have ended a structure at the 81.99 H, again of any degree, we should expect the retracement process to be much deeper than a 38.2%.
It appears to me that we may have traced a H/S topping pattern. If this is the case, it would measure down to around the 61.8% retrace level at 73.81.
Watch price as it retests the broken neckline. A failure here would allow good entry for a short.
RSI has reached a level on this 120 minute chart where we should expect at least some type of bounce.
The dollar continues to make new highs from the move off its 75.085 L. This is worth paying attention to folks.
Market

Yesterday's range on the ES was 25 handles, while volume was very heavy and expanding.
Volume has continued to expand during this sell off, suggesting that distribution has been taking place.
Wednesday, October 28, 2009
BINGO!!
FINALLY HIT- Actually went below. Should now get a reaction bounce here - Problem is might not be lot as internals are still not improving.
Will post a chart tonight on my thoughts-
Will post a chart tonight on my thoughts-
Nasdaq
Very important what is happening here to the Nasdaq. Leader on the downside, remember it was the leader on the upside, telling tale.
BINGO!!!!
Bingo on the 1054 actually printed 1052.75. Lets see if we bounce- actually out my short from 1083 there SWEET!!! took long enough
Tuesday, October 27, 2009
Crude

Structure continues to look and act like a 4th wave. This would suggest that we see higher price eventually.
There is a chance that this is a bigger triangle pattern. If you assume that the 77.64 L is a, the 81.99 H is b, we would have finished a complex c at the 77.81 L. I rate this as low probability though.
The US dollar appears to have put up a 5th wave structure to the upside. Be mindful of that.
No daytime updates today
Will be busy today so no intra day updates. Have a feeling we will test that 1054 area this week- Becareful of a turn around tuesday- watch the volume
Crude Update

After an initial morning rally, the crude pits turned bearish and there was nice downside price action. Range was a healthy $3.61 on expanding volume.
I wanted to point a couple of things out on the daily front month.
We have broken the up trend line on RSI. If you scan back across the chart, you will notice that in the previous cases where this has occurred, nice healthy corrections followed.
Notice as well, the negative divergence put in on the RSI. Is this telling us that minor C is finished? While certainly possible, I don't believe that's the case.
It appears to me that we would be missing an additional leg higher.
The intraday continuous contract shows the two ways I'm currently viewing structure.
So far, this corrective has the look and feel of a 4th wave. I have two sets of retracement fibs on the chart. The set on the left is measured from the beginning of (i) or [i], while the set on the right is from the wave (ii) or [ii] low.
Notice that the push higher this morning was turned back at the base corrective channel.
As I stated in the weekend update, we really need to see how this retrace plays out to give us a better handle on structure. I will assume a [iv] wave until proven otherwise.
We do have a divergence with today's lows, suggesting that perhaps the move off the 81.58 H needs some retrace.
Did you notice the move in the dollar today? Kind of hard to ignore in my opinion. Watch the 76.85 level. We are also at the 50% level on RSI. Price has been turned back the prior six times RSI has reached this level. Does it finally get through?
Monday, October 26, 2009
SO what now
The market just took back all the gains it made since the beginning of the earnings season. I am not ready to call it yet till be get those reaction numbers touched. Bingo on that crude!!!!
Markets
Ok S&P CRACKED A LITTLE HERE- As said short from last 1083 but man That was some big push down from today's high.
watch this 1067 area if it can't hold next up 1054 (Only logical)
watch this 1067 area if it can't hold next up 1054 (Only logical)
Saturday, October 24, 2009
Crude Update

The crude market finished the week with another positive gain.
We finished something at the 81.99 H. I believe it was a minuette wave (v), which would complete a minute degree wave.
I'm entertaining the idea that it just may be a [iii] wave. The retracement will give us a better idea.
The 38.2% retracement level is 77.17, while the 50% sits at 75.68.
The triangle target is 83.99. The continuous contract numbers can change when they put on a new front month, which is why this number is slightly different.
Bottom line - the retracement process does not appear complete to me. Should price trade through the 81.99 H, then it will be obvious that (v) has not finished.
Dollar Update

Fresh new lows for the bucky this past week - not unexpected.
My interpretation remains the same. Minuette wave (v) of minute [v] of minor 5 of intermediate (C). We inch closer and closer to an important bottom.
Price found support at the 78.6% retracement of the primary [A] leg off the 71.05 L. We are very near the minimum downside objective of 74.79, which is where 5 = 61.8% of 1 - 3.
Notice that RSI supported on its rising trend line, again giving positive divergence. Pay attention to the 50% level (upper trend line) to see whether it can finally break through.
I'm not sure this would signal an end to the downtrend, however, I do believe it would be meaningful.
Bottom line - As mentioned last week, this trend is very mature. It could end at anytime. Any upside price action should be viewed with suspicion, until an impulse has taken place with a channel break.
Markets
It would be so nice indeed if the markets did something. We are in no man's land with light volume no conviction and the conflicting reports of the news. We are technically moving lateral for a time now with alot of head fakes both ways but when you study things, the past month or so has seen the market grind up and down due to opposing forces from both the bullish side and the bearish side of the ledger. The bulls can talk quite a bit about what's being reported from our Government. Most of the economic news is favorable these days. It tells us the worst of things has passed on by. Has it? I am not so sure but that's their suggestion. The market is buying it for now. The bulls can also claim that earnings are coming in better than expected. Are they really? Well, I am not so sure since many, not all, but many of the better reports are due to cost cutting.How do we know? Earnings are beating in many cases by a huge amount yet revenues are only in line or in many cases, even a drop below. Cutting costs by cutting jobs and or job hours. Not exactly a pillar of health but hey, for now the market doesn't care and that's all we care about when playing this silly game. So earnings and economic news are clearly on the side of the bulls. On the side of the bears we have overbought daily charts in conjunction with massive consecutive negative divergences on the those same charts. A very ugly combination. We also have massive price resistance just above on those trend lines you'll see in the charts in this report. You also have a high number of stocks on a high pole that need to pull back. Their moves very mature meaning any upside from here is labored at best. It can occur but won't be easy by an means. Stocks on high poles with negative divergences and overbought can be a real headache for the bulls thus expecting much upside near term isn't wise. So the bulls have some advantages and you can see the bears do as well. It all equates to a market that has moved laterally for the last month plus and we all know lateral market are absolutely no fun.
We are doing NOTHING here but opening and closing the markets I hope we get some resolution out of this annoying range bound market soon or it will put me to sleep for 10 years :) Thank goodness for Oil!
MARKETJEDI
We are doing NOTHING here but opening and closing the markets I hope we get some resolution out of this annoying range bound market soon or it will put me to sleep for 10 years :) Thank goodness for Oil!
MARKETJEDI
Subscribe to:
Posts (Atom)